
Reporting
Track business performance with Arketa's analytics dashboard and detailed reports.
Arketa's reporting is built around two views: a visual Analytics Dashboard for high-level trends, and Reports for detailed, exportable data.
Analytics dashboard
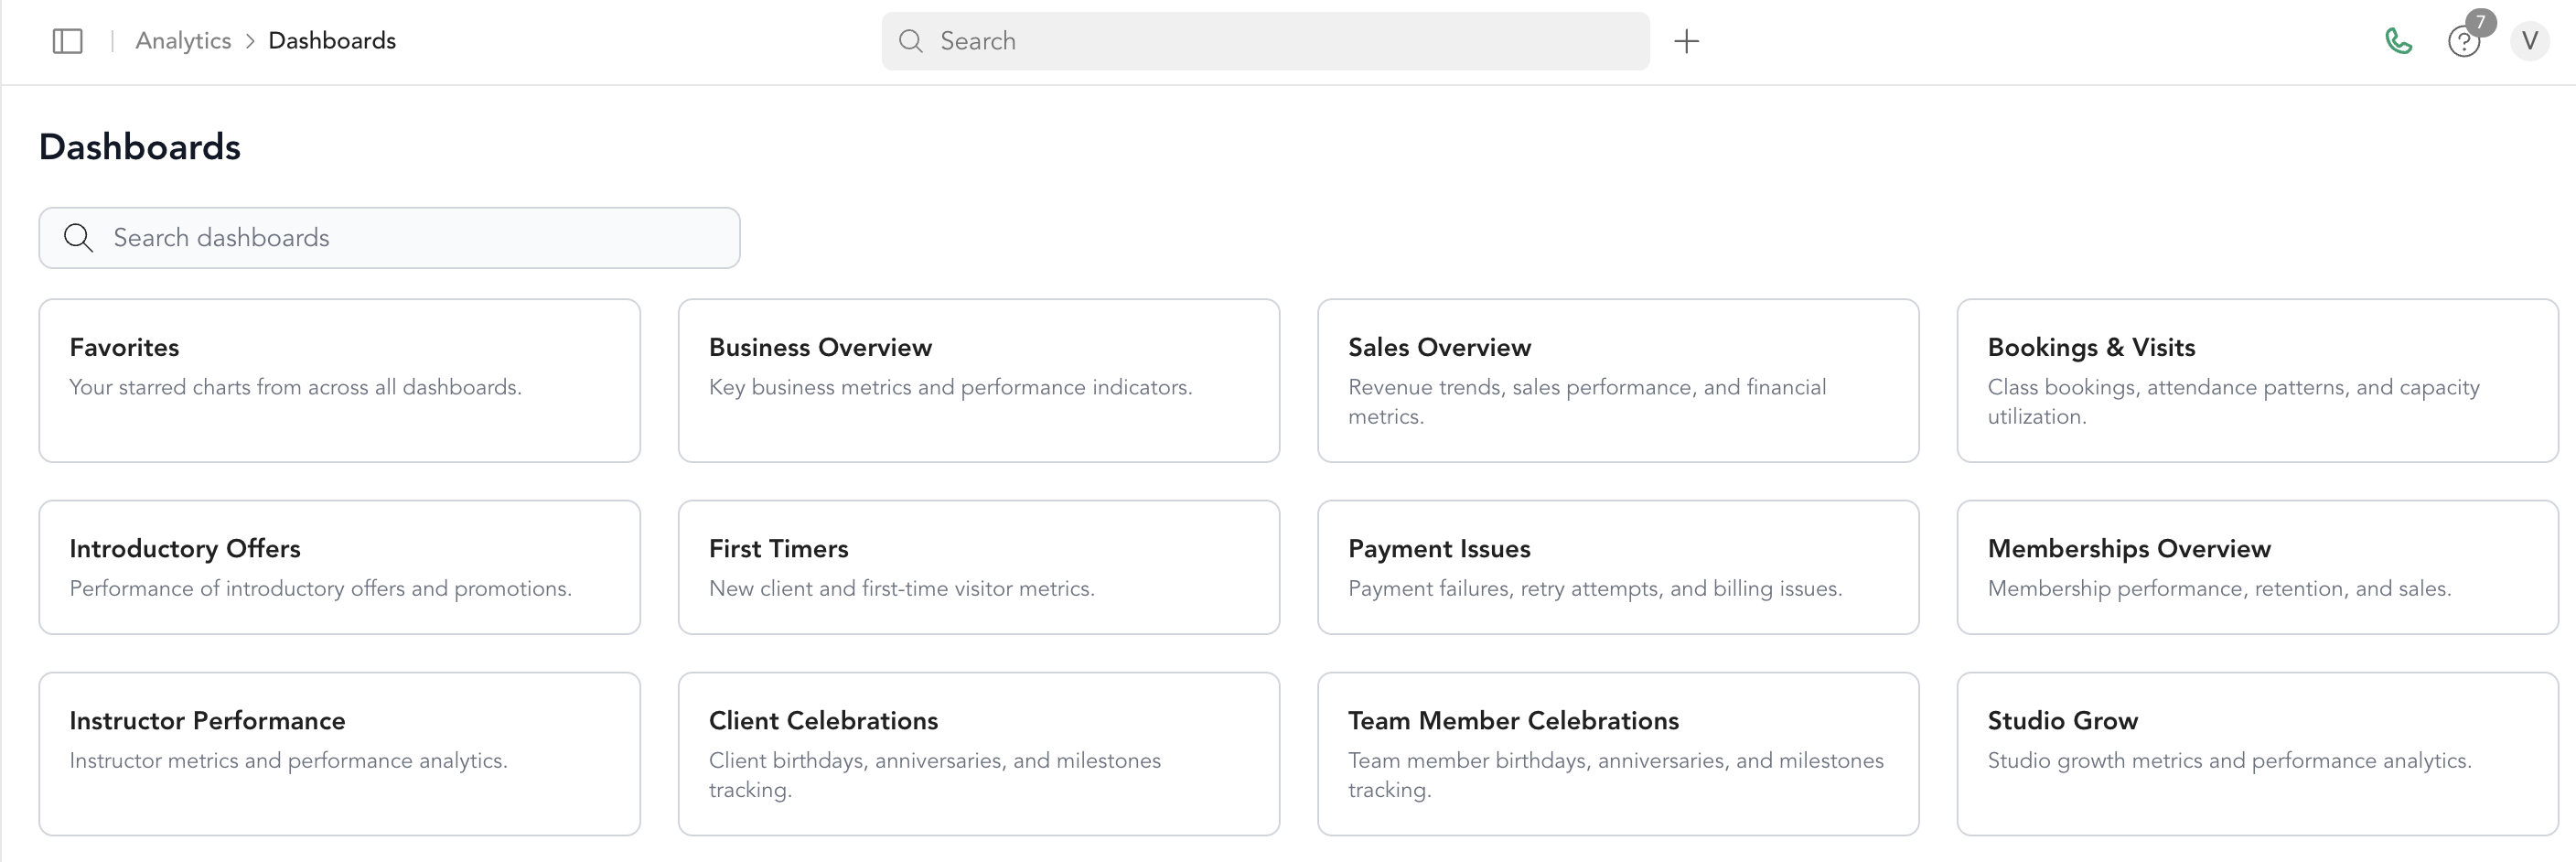
Go to Analytics → Dashboard to see:
- Total sales and net sales
- Sales by category (class packs, subscriptions, bundles, etc.)
- Sales over time
- Active subscriptions
- New memberships and membership trends
- Bookings and visits over time
- On-demand video views
- Class and appointment attendance
Filter by date range (7 days, 30 days, or custom), time granularity (day/week/month), and location.
Reports
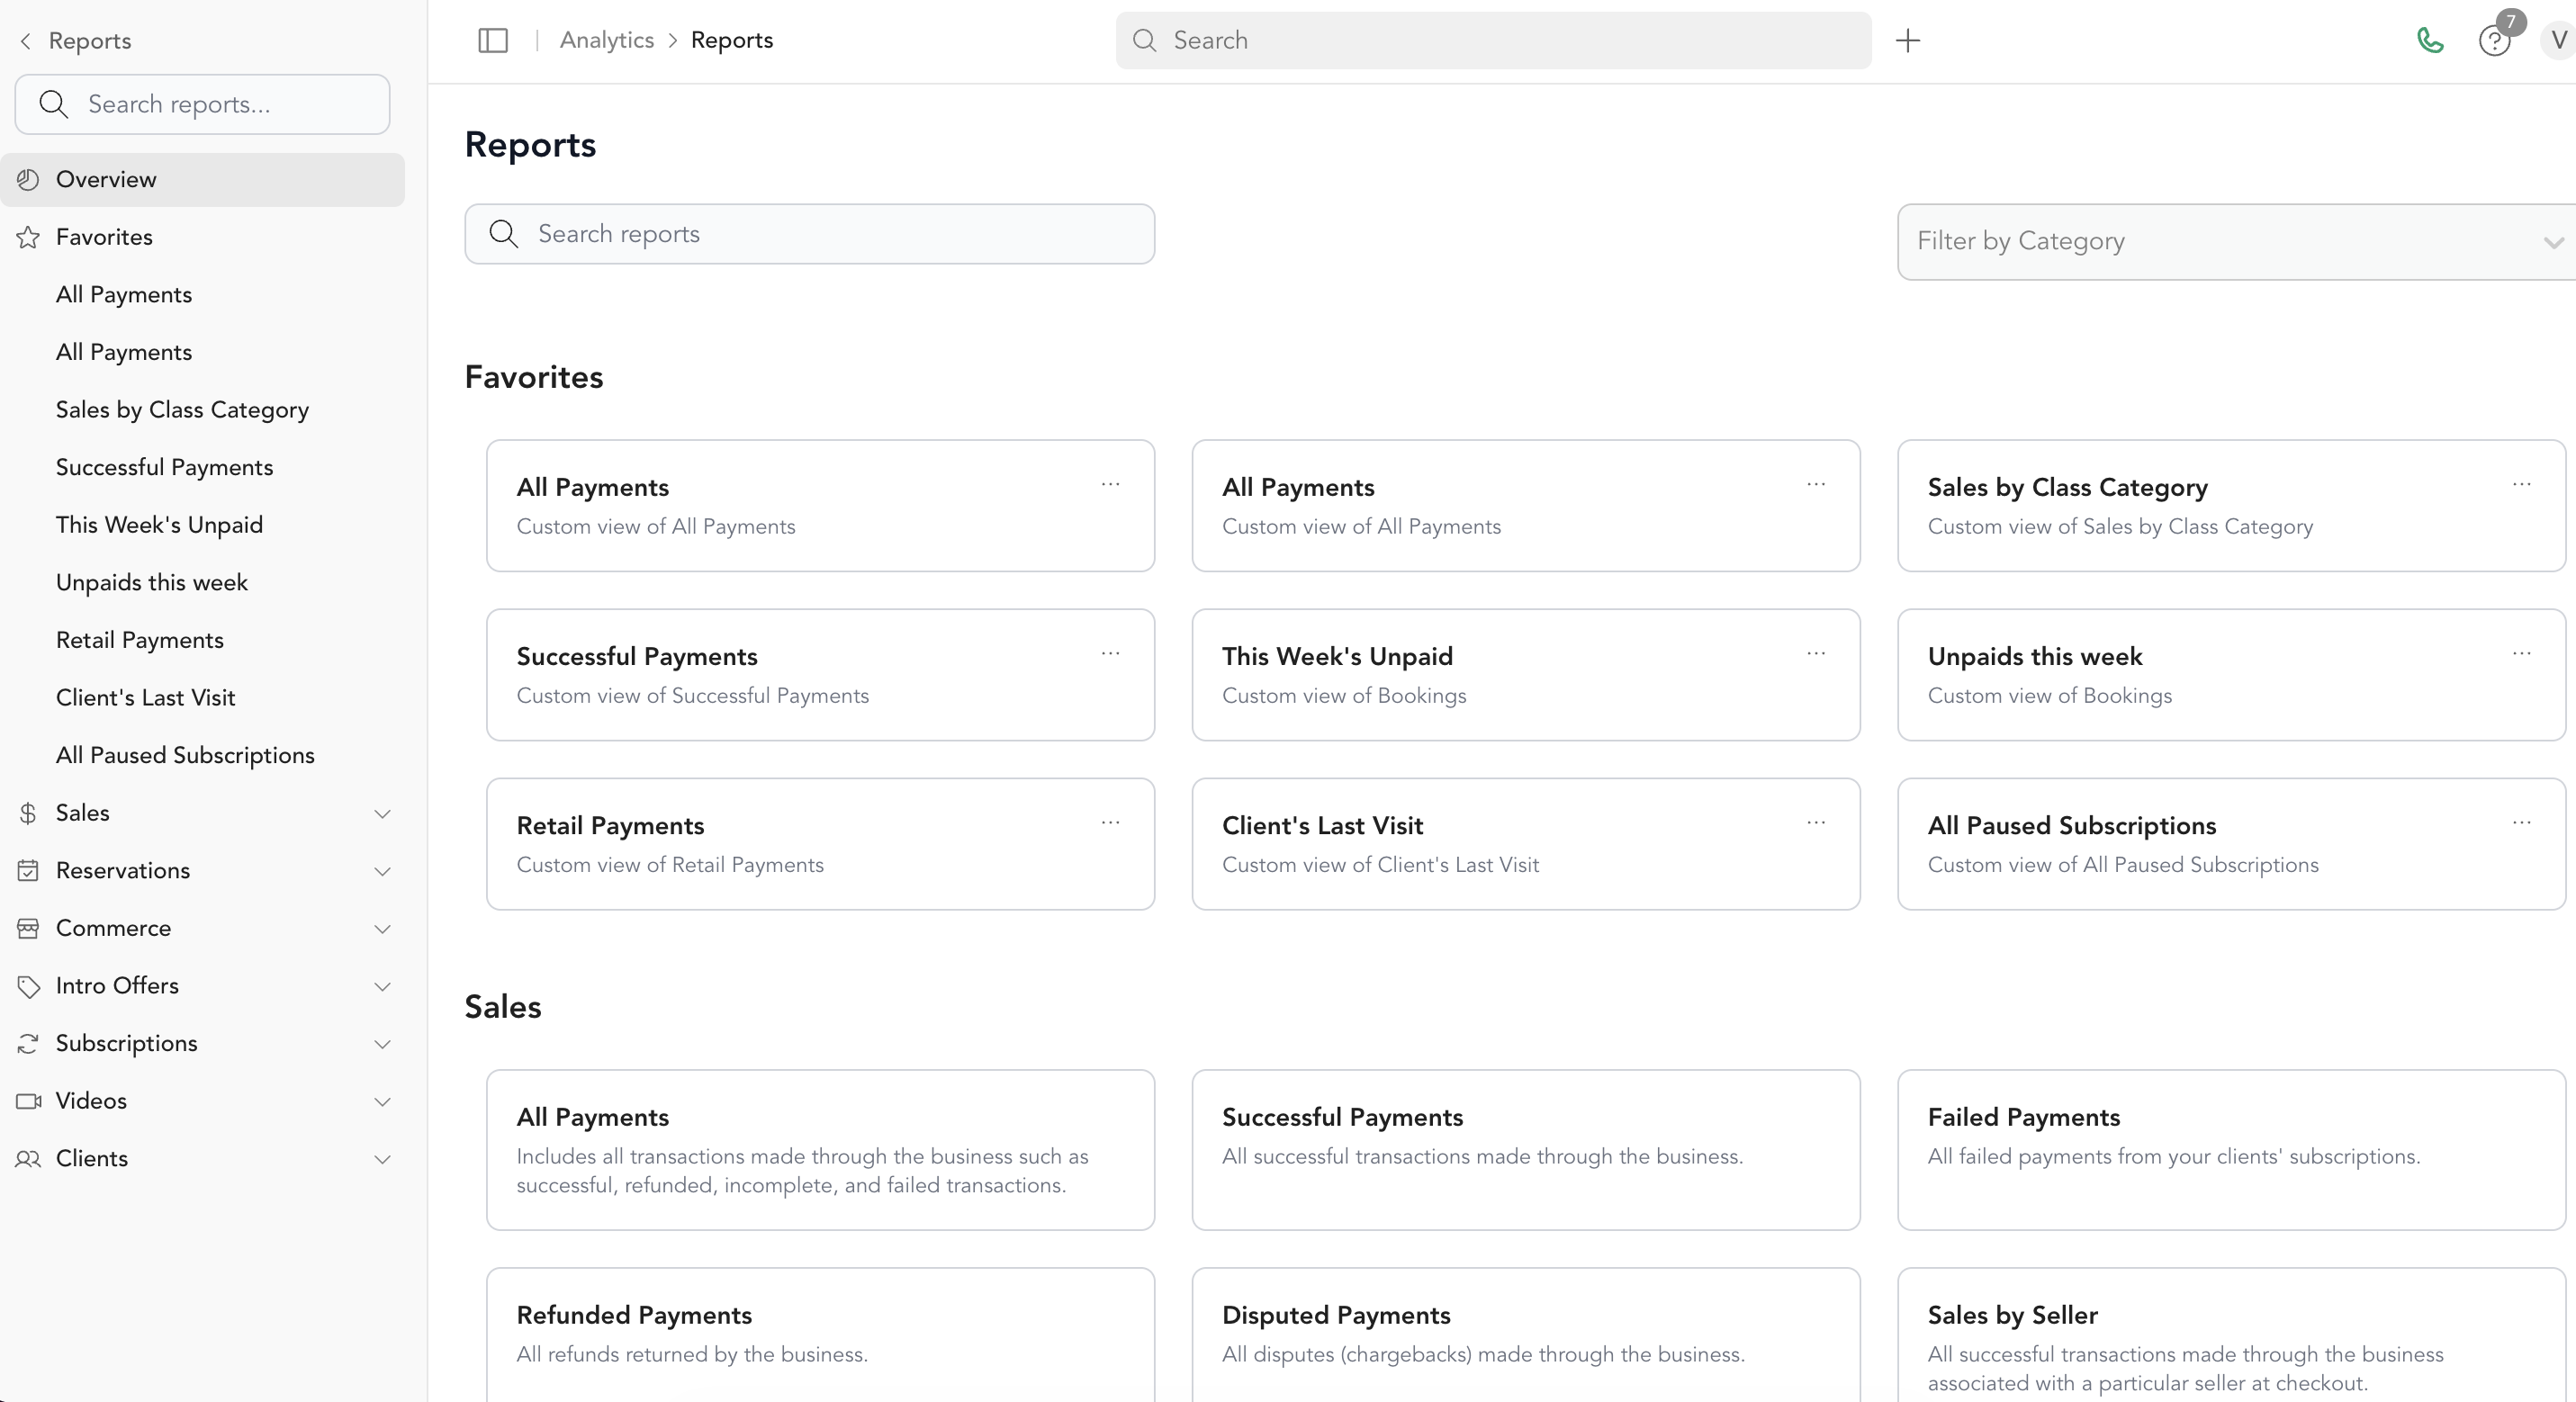
Go to Analytics → Reports for detailed, filterable, exportable data across all areas of your business.
Export a report
- Go to Analytics → Reports
- Click the report you want
- Click Export
- Select which data points to include
- Choose PDF or CSV
- Click Download Report
Large reports (e.g., a full year of bookings) may take up to 5 minutes to process.
Save a report as a favorite
If you pull the same filtered report often, save it as a favorite so you don't have to rebuild the filters each time.
- Go to Analytics → Reports
- Click the report you want and set your filters
- Click Submit to apply the filters
- Click Save as favorite
- Give the report a memorable name
Your saved reports appear at the top of the Reports tab under Favorites. Click a favorite to open it, or click the ... menu to rename or remove it.
Report categories
Bookings
Reservations, attendance, late cancels, no-shows, unpaid bookings
Sales
Payments, revenue by class/seller/pricing option, refunds, tips, failed payments
Subscriptions
Active, canceled, expired, past due, trials, renewals
Clients
New clients, retention, visit averages, credit balances, gift cards
Retail
Retail sales, inventory, product-level reporting
Finance
Balance summary, accounting, 1099-K