Sales by pricing option
See revenue broken down by individual package and subscription name.
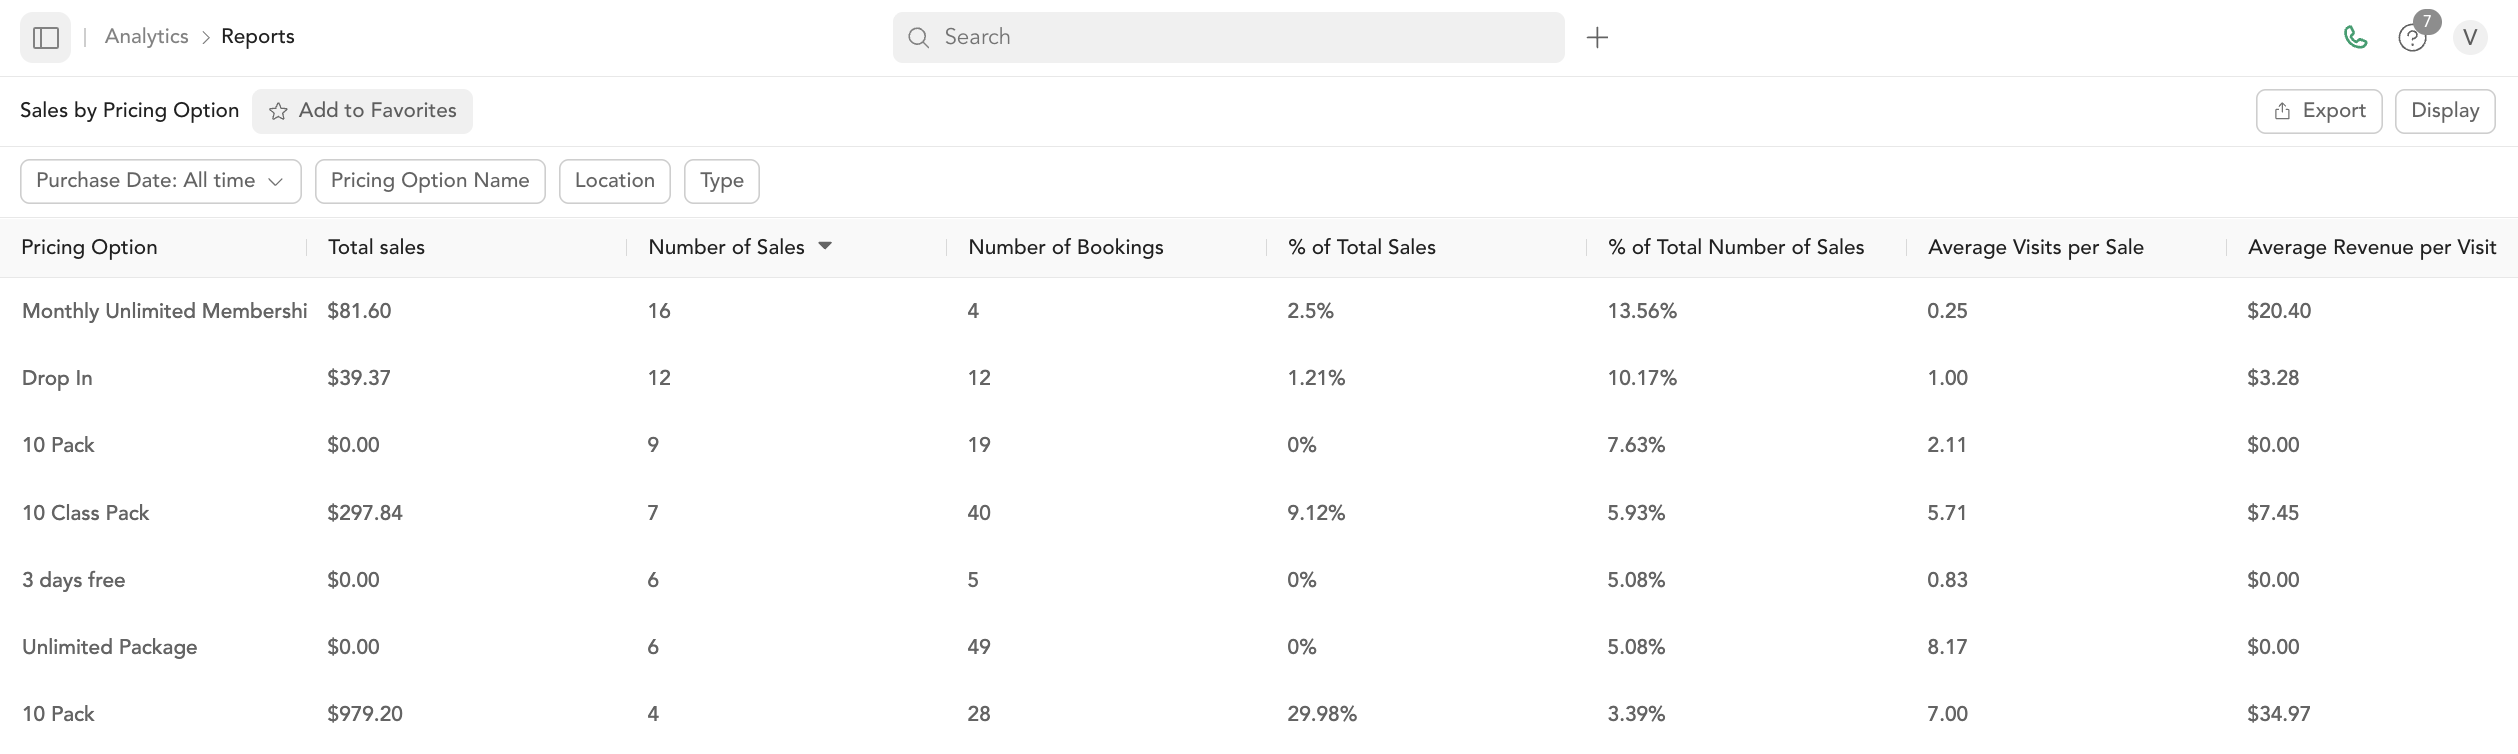
The Sales by Package and Subscription report shows how much revenue each specific pricing option has generated — useful for understanding which products clients are actually buying.
Only package and subscription (pricing option) sales appear here. Per-session drop-in payments — including appointments checked out at the drop-in price — are not pricing option purchases, so they won't show in this report even when you filter by a pricing option. A drop-in charge is named after the service (for example "Deep Tissue Massage 90 Minute"), which is different from the matching pricing option (for example "Massage - Deep Tissue 90"). To see drop-in and appointment revenue, use the All Payments or Private Services Payments report. To have a sale attributed to a pricing option here, sell the matching package at checkout instead of charging the drop-in price.
Columns
| Column | Description |
|---|---|
| Pricing option name | Specific package or subscription name |
| Total revenue | Total amount collected |
| Number of purchases | How many times it was purchased |
| Refunds | Total refunds for this option |
| Net revenue | Revenue minus refunds |
Filters
Date range, pricing option type (pack, subscription, bundle, etc.), and customer.
How to use this report
- Identify top sellers — which plans drive the most revenue
- Spot underperformers — options with low purchase counts may not be needed
- Evaluate promotions — compare revenue from promo-code purchases vs. full-price
This pairs well with the Intro Offer Conversion report to see how many intro offer buyers convert to memberships.