Analytics dashboard
Use the visual analytics dashboard to track sales, memberships, and engagement trends.
The analytics dashboard gives you a visual overview of business performance without needing to run individual reports. Access it at Analytics → Dashboard.
Filters
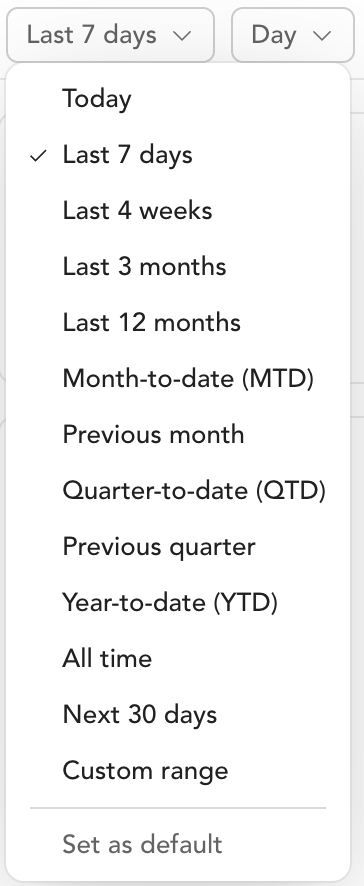
At the top of the dashboard, filter by:
- Date range — last 7 days, last 30 days, or a custom range
- Time granularity — view data by day, week, or month
- Location — filter to a specific location if you operate multiple studios
Dashboard sections
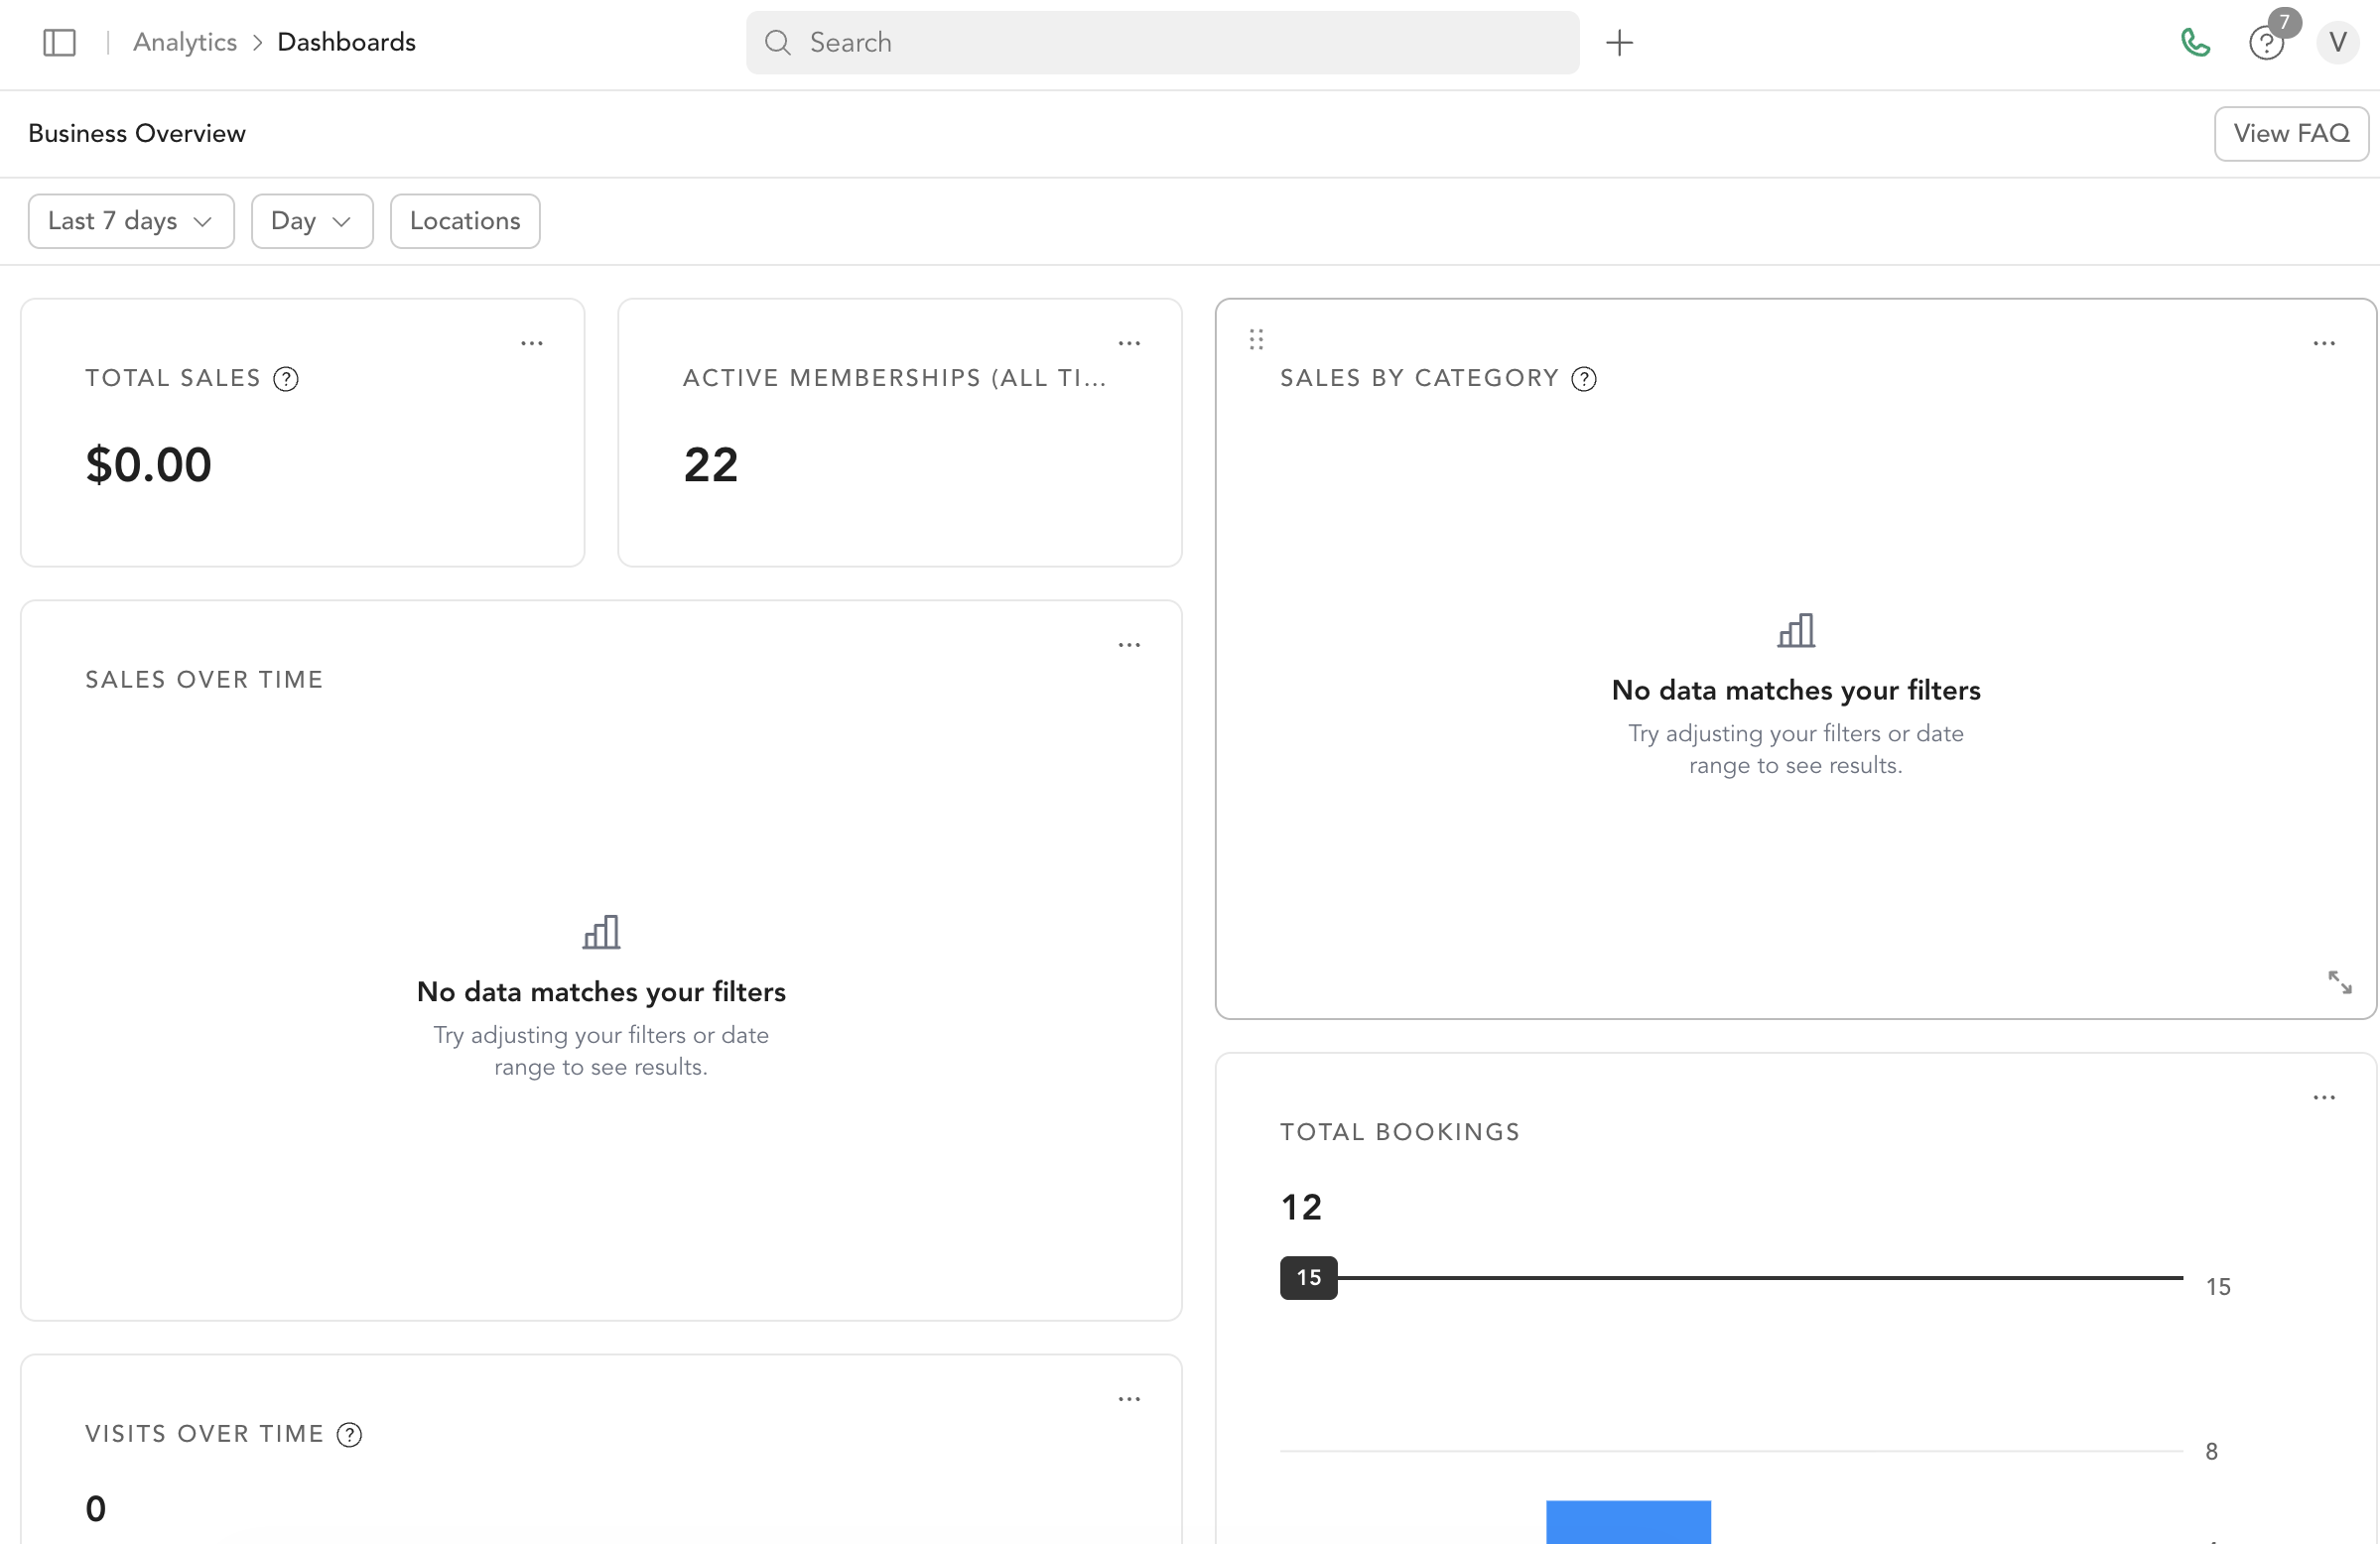
Business overview
Total Sales and Net Sales
- Total sales: amount paid by clients
- Net sales: total paid minus taxes, Stripe fees, and Arketa fees
Sales by Category Revenue broken down by product type: class packs, subscriptions, drop-ins, bundles, penalties, and other.
Sales Over Time Bar chart of daily sales in your selected date range. Look for spikes around promotions and dips in slow seasons.
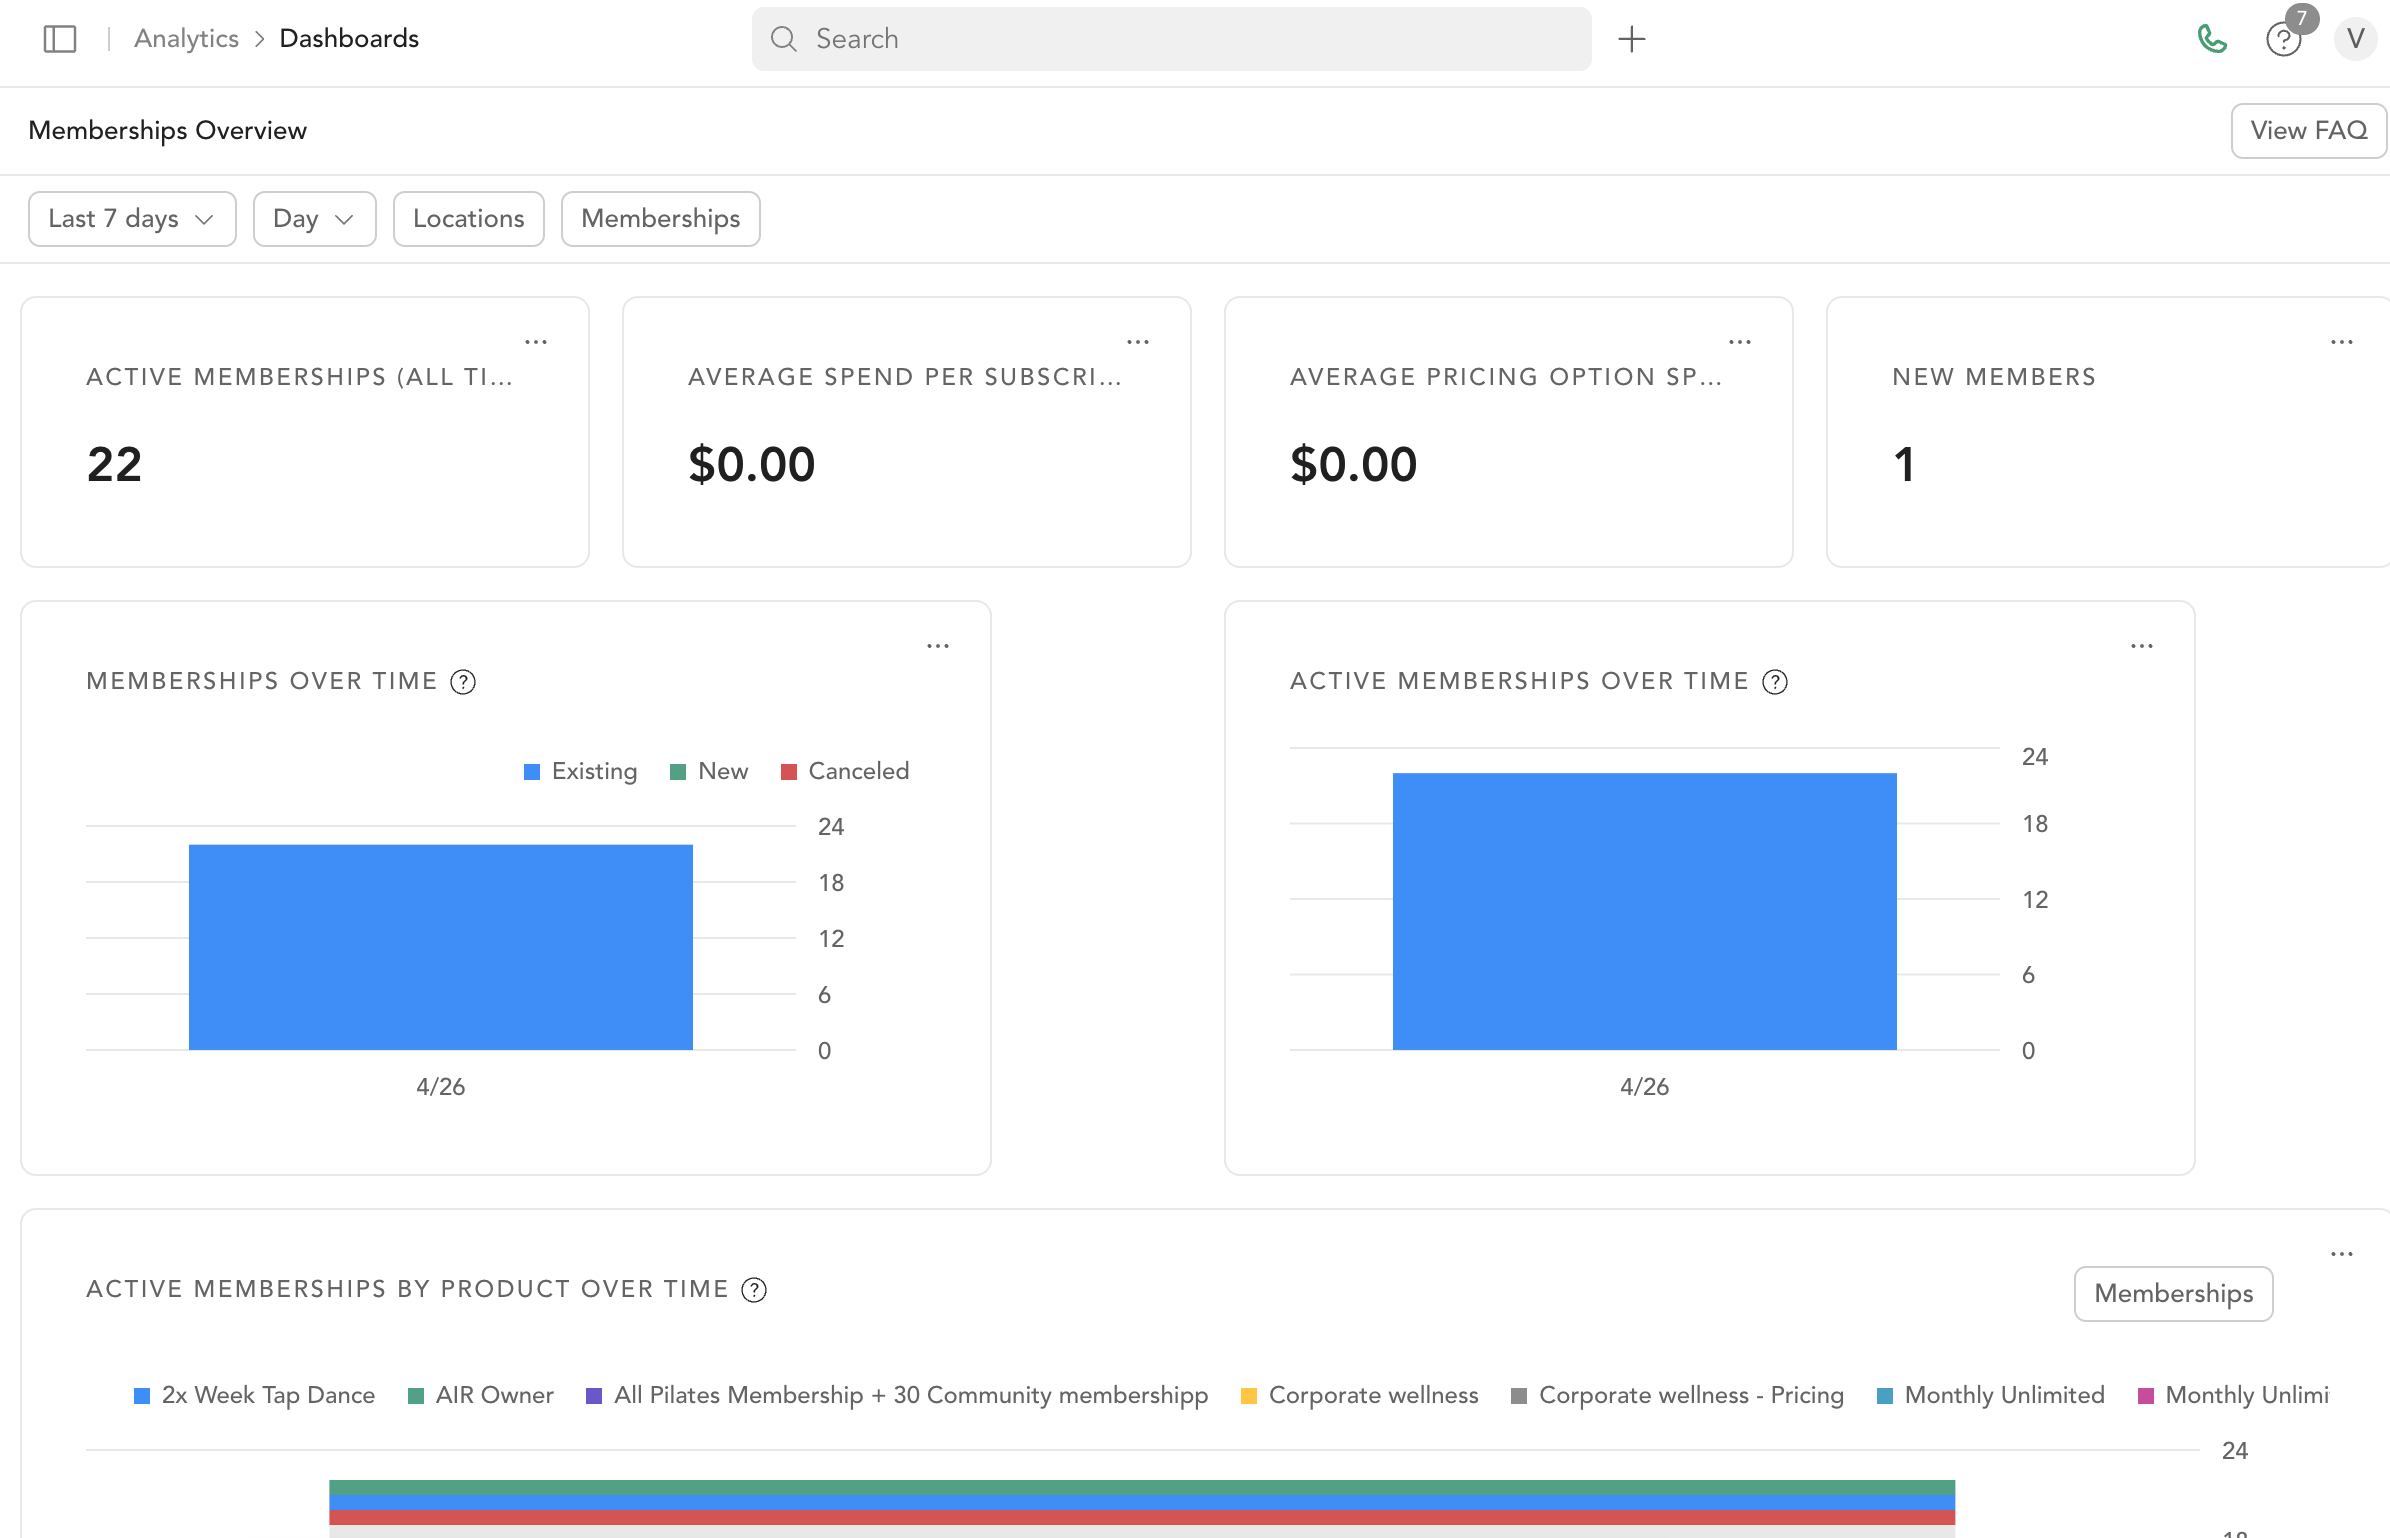
Membership

Active Subscriptions (All Time) Total clients with an active recurring subscription.
New Memberships Over Time Membership vs. non-membership net sales comparison.
Active Memberships Over Time Daily count of active memberships — useful for tracking retention trends.
Bookings and visits
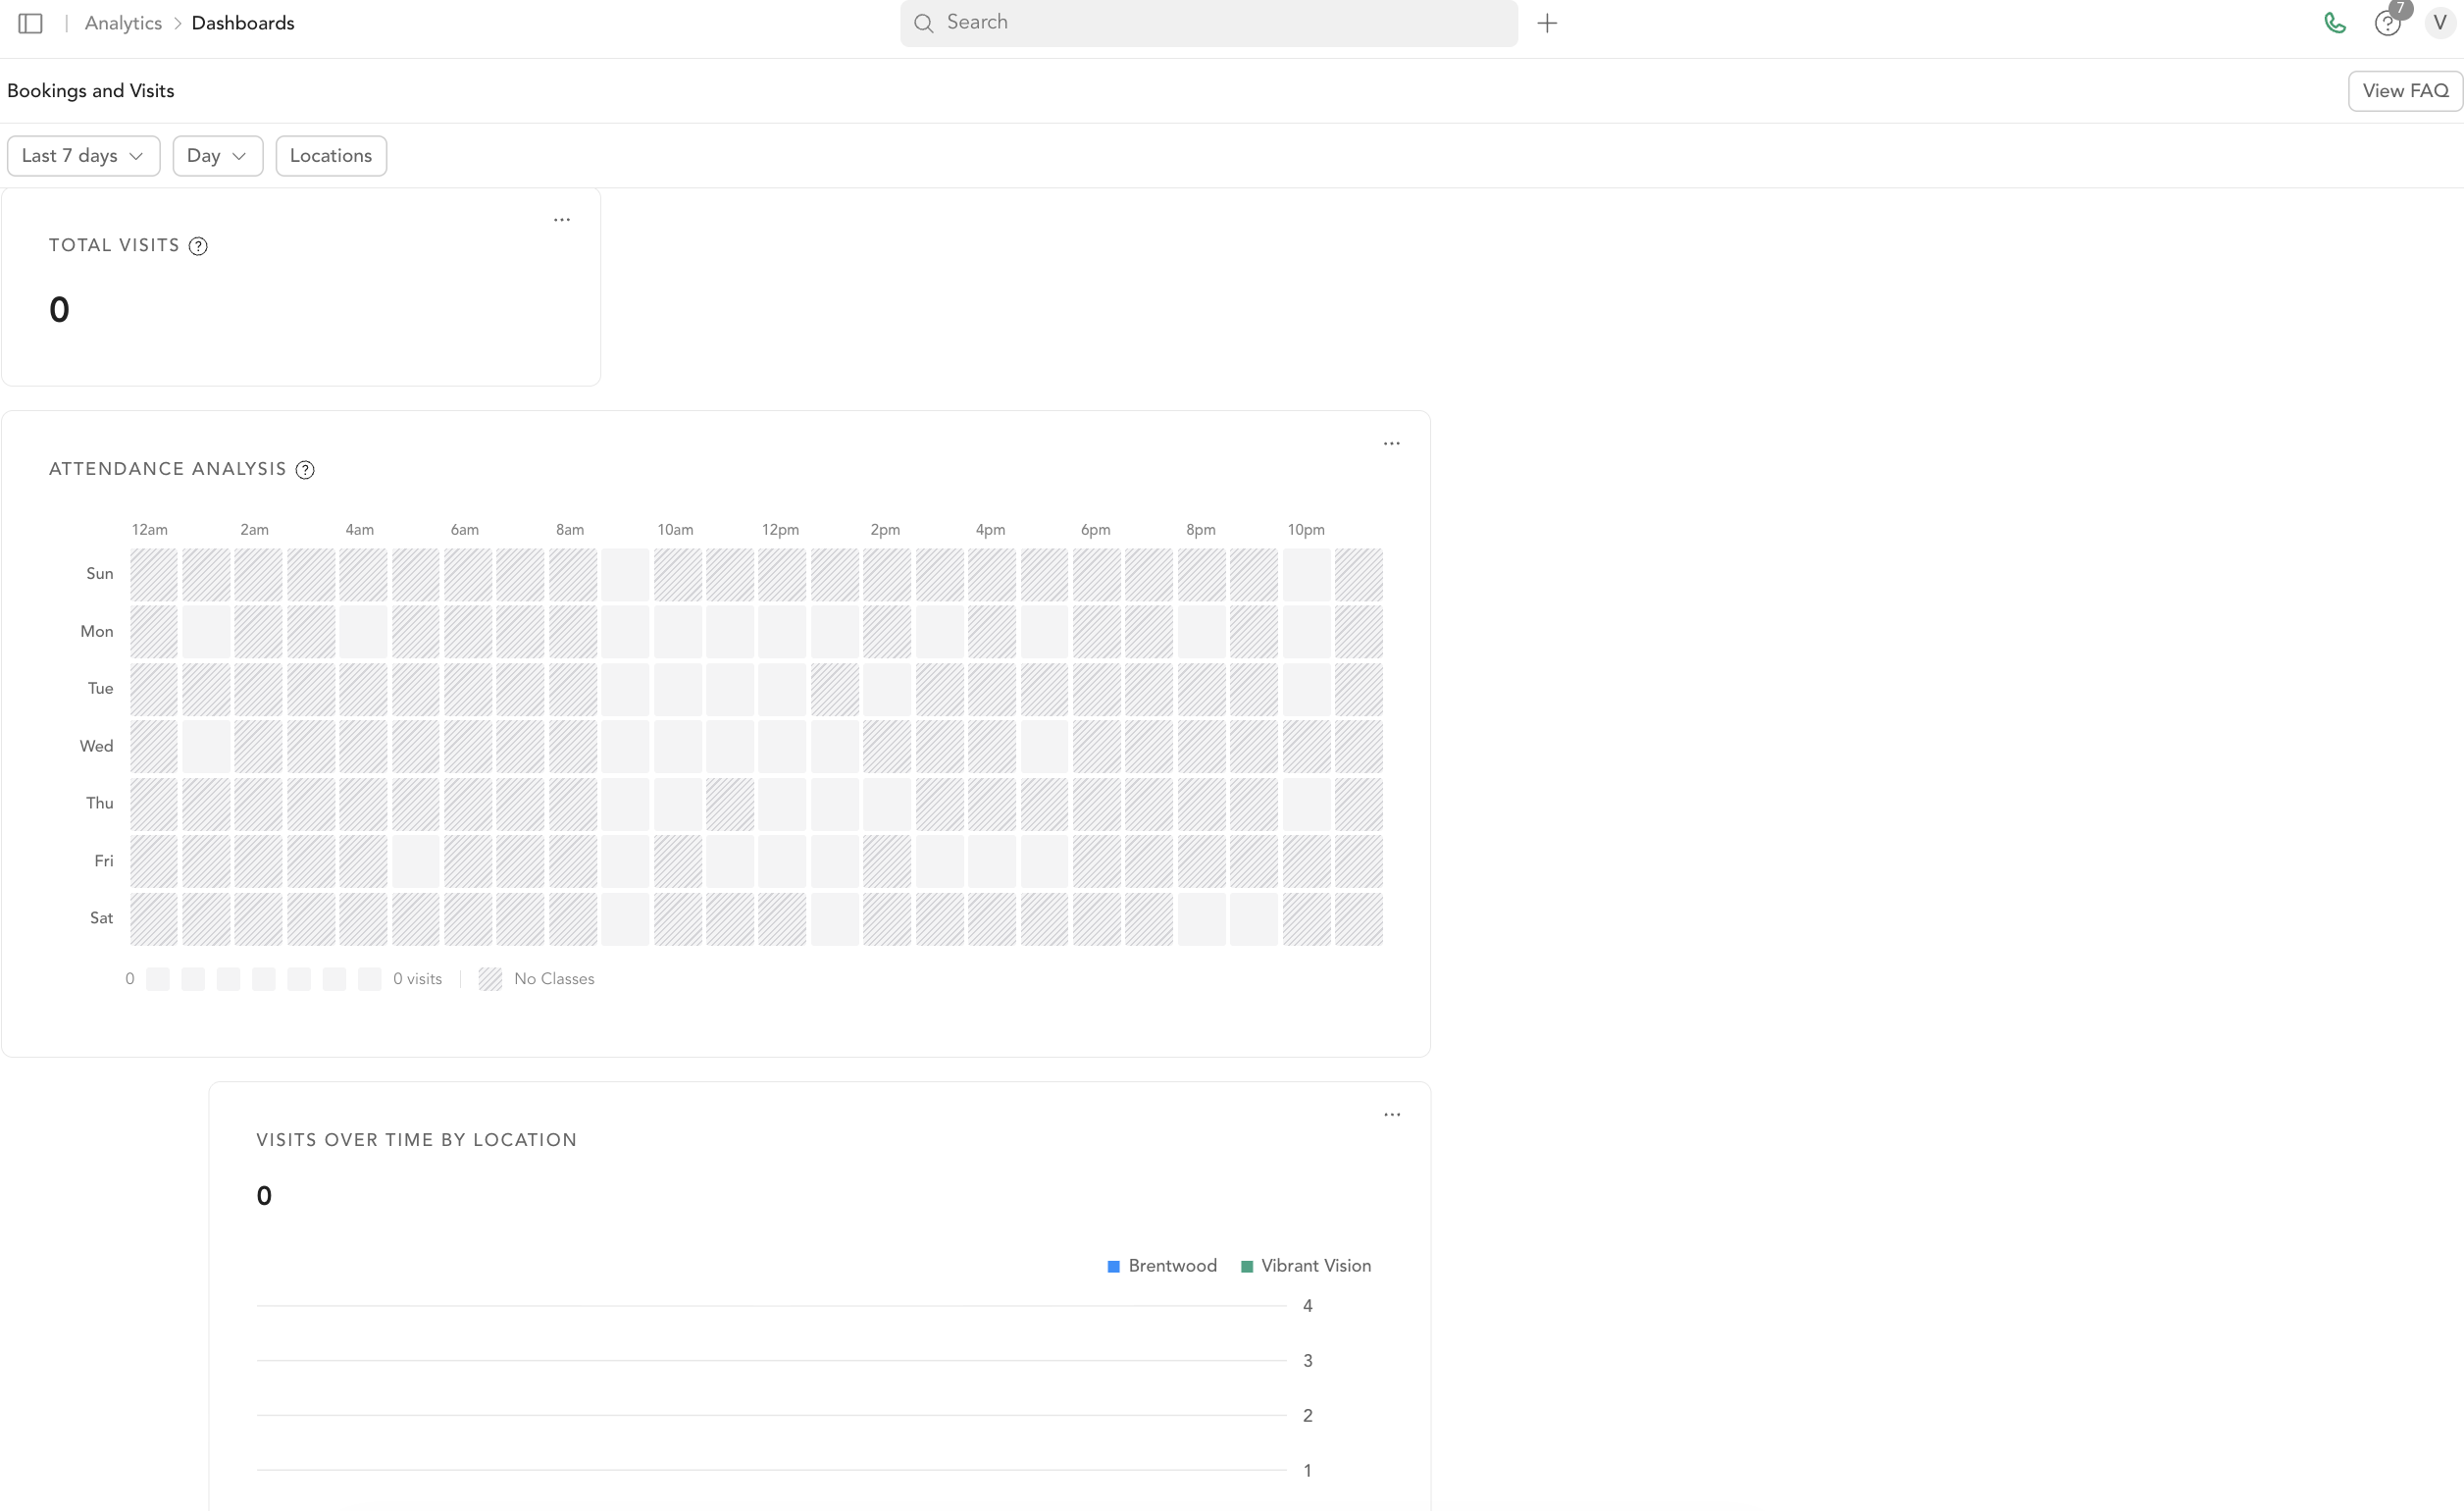
Total Bookings and Visits Over Time
- Bookings: classes, events, or appointments reserved
- Visits: actual check-ins per day
Class and Appointment Attendance Attendance trends — daily attendees over time.
Revenue breakdown
Sales by Pricing Option Which specific pricing options are generating revenue (drop-in, 10-class pack, monthly membership, etc.).
Sales by Revenue Category High-level revenue groupings — memberships, classes, retail — for a quick view of major revenue streams.
Class Sales by Purchase Type Over Time Estimated net revenue from class bookings, grouped by how each reservation was paid for: Subscription, Pack, Community, Drop in, and so on. Community covers bookings made through a community offering — for example a teacher training or challenge program run as a community.
Two things to keep in mind when reading this chart:
- It's based on class dates, not purchase dates. A community sold once can generate a booking for each session a client attends, so its revenue is spread across every class date in the range rather than showing up as a single line.
- The amounts are estimated net revenue allocated per booking, not payment records. That's why totals here won't line up with Sales by Pricing Option or the Successful Payments report, which are based on actual payments and purchase dates.
On-demand
Video Views Over Time Daily on-demand video view count.
What the dashboard is best for
- Spotting trends (growth, decline, seasonal patterns)
- Comparing membership revenue to other sources
- Tracking retention through active membership counts
- Monitoring daily sales activity
For detailed line-item data, use the available reports.
Studio Grow dashboard
The Studio Grow dashboard is a separate, opt-in dashboard for studios using Studio Grow. Find it at Analytics → Dashboard → Studio Grow. If you use Studio Grow but don't see this option, reach out to the Support team to turn it on for you.
It uses the same date range and location filters as the standard dashboard, so you can scope every widget below to a specific timeframe or studio.
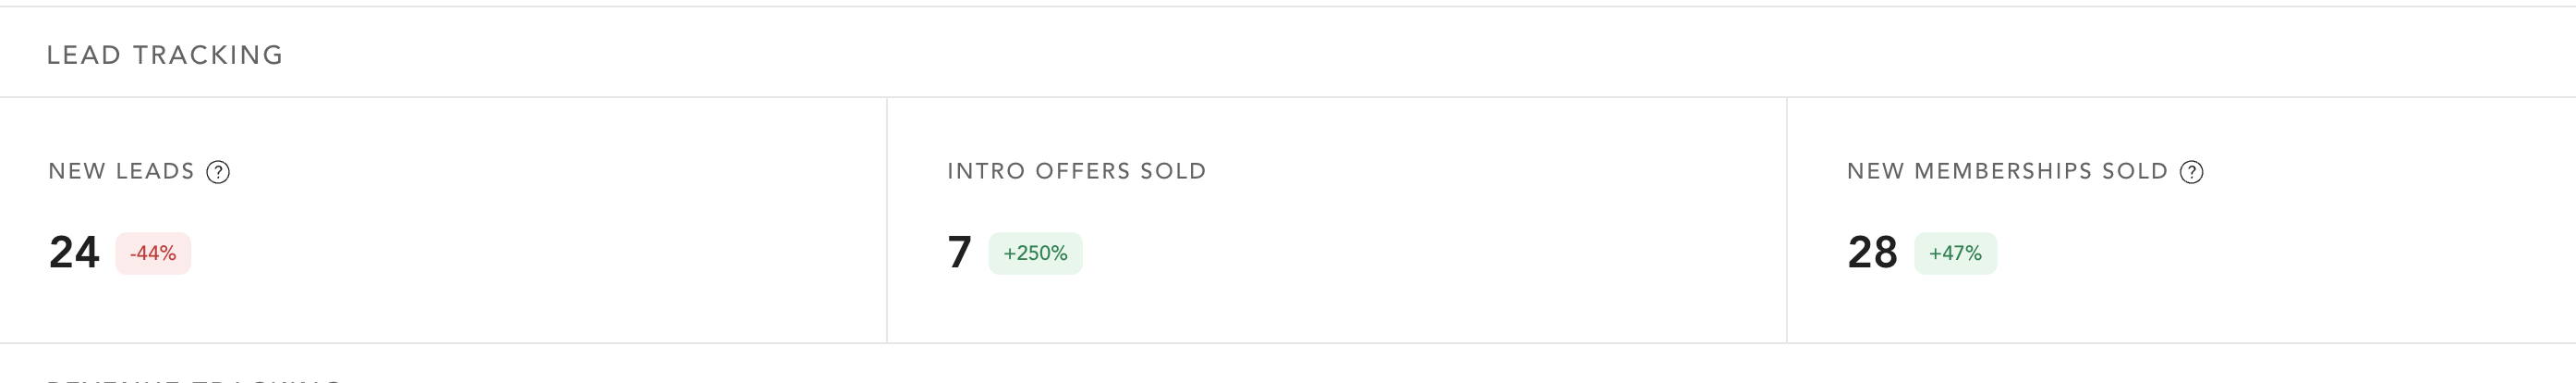
Lead Tracking
New Leads Total number of new leads generated within the selected timeframe.
Intro Offers Sold Number of intro offers sold in the given timeframe.
New Memberships Sold Number of new memberships sold in the given timeframe.
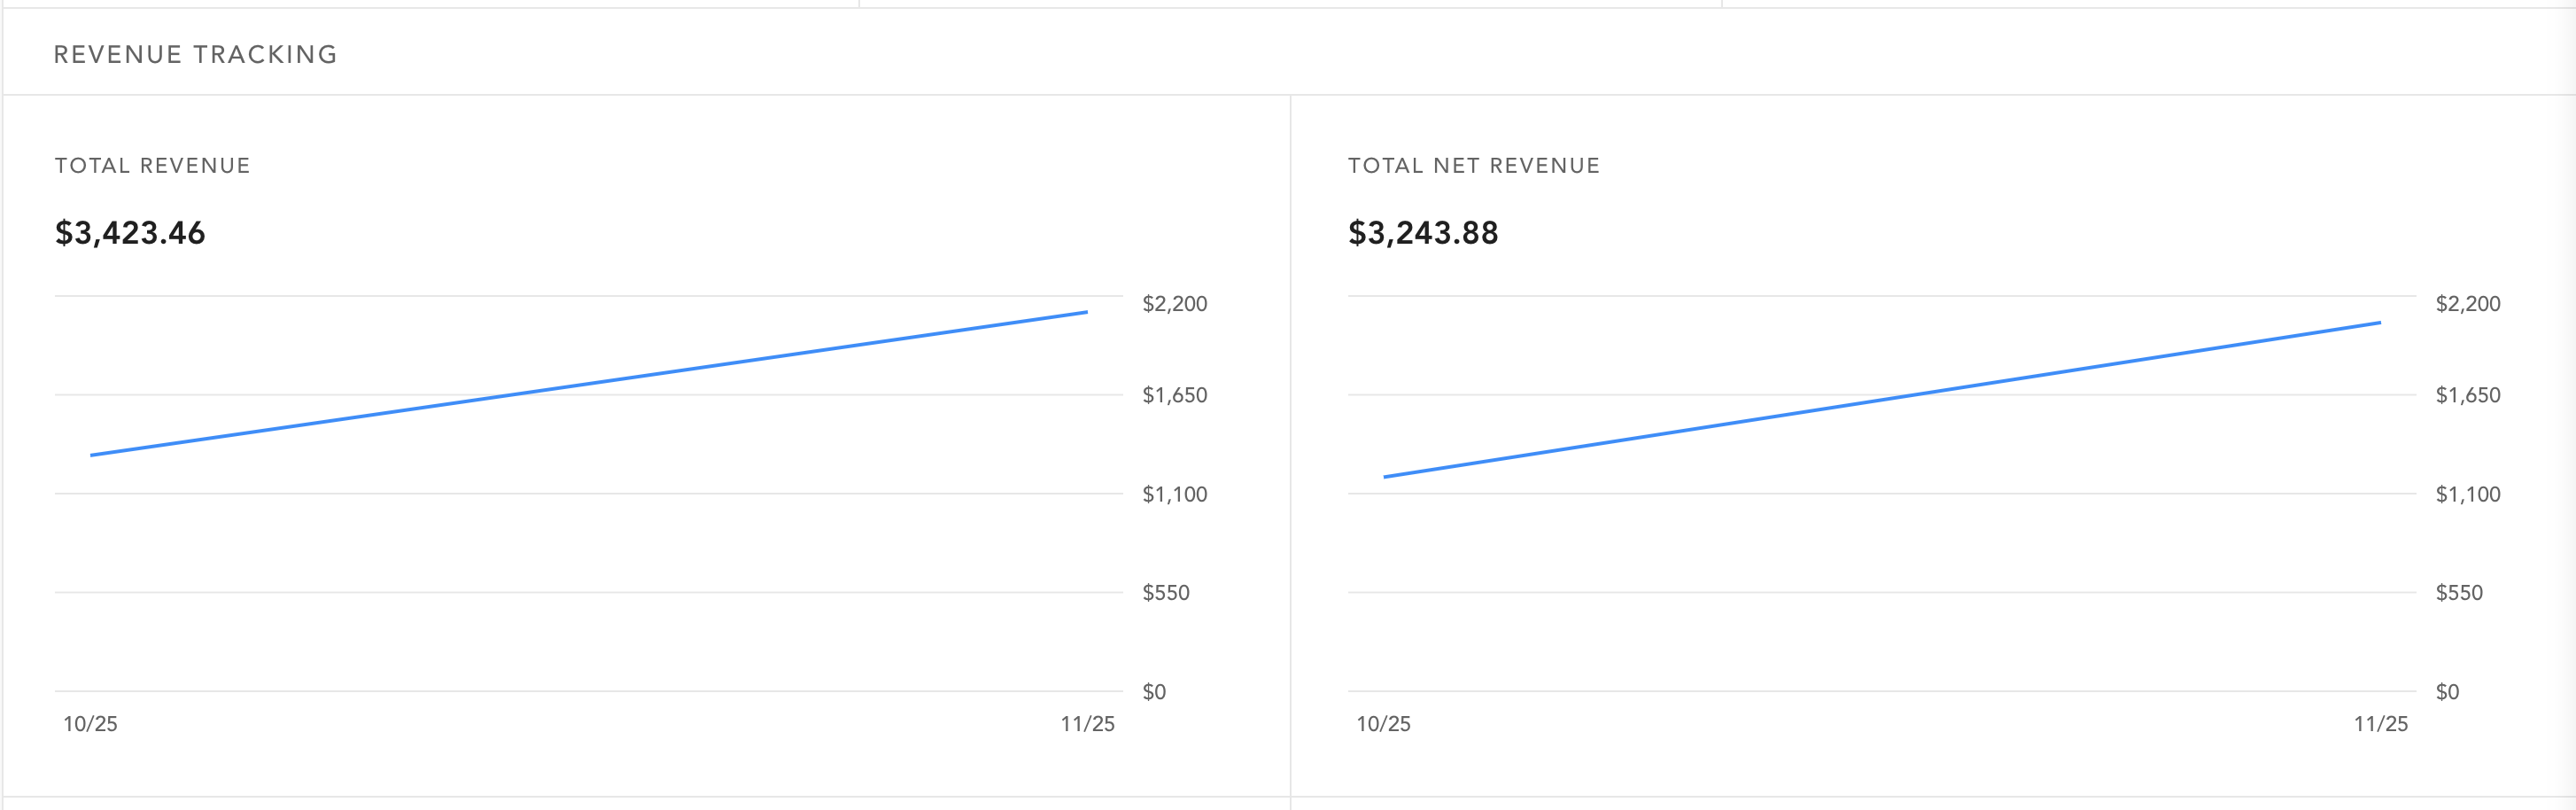
Revenue Tracking
Total Revenue All revenue generated within the period.
Total Net Revenue Net revenue after refunds or adjustments.
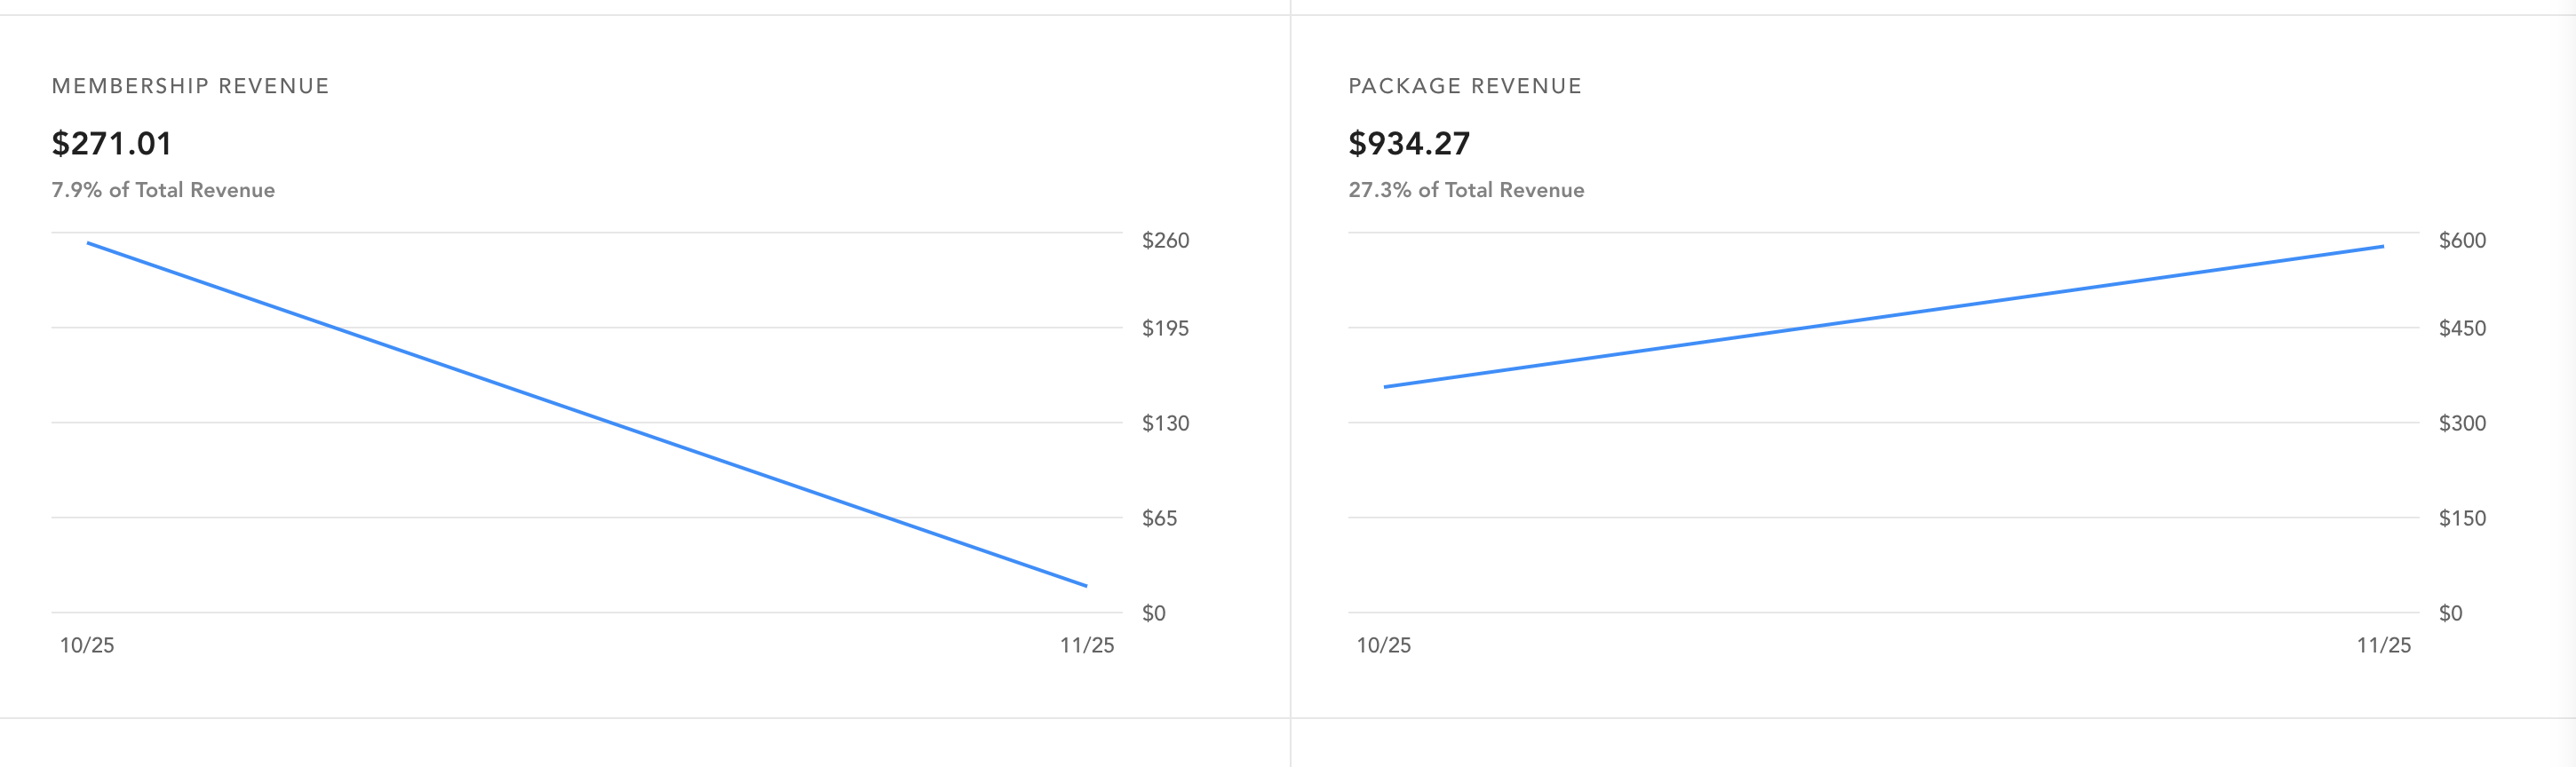
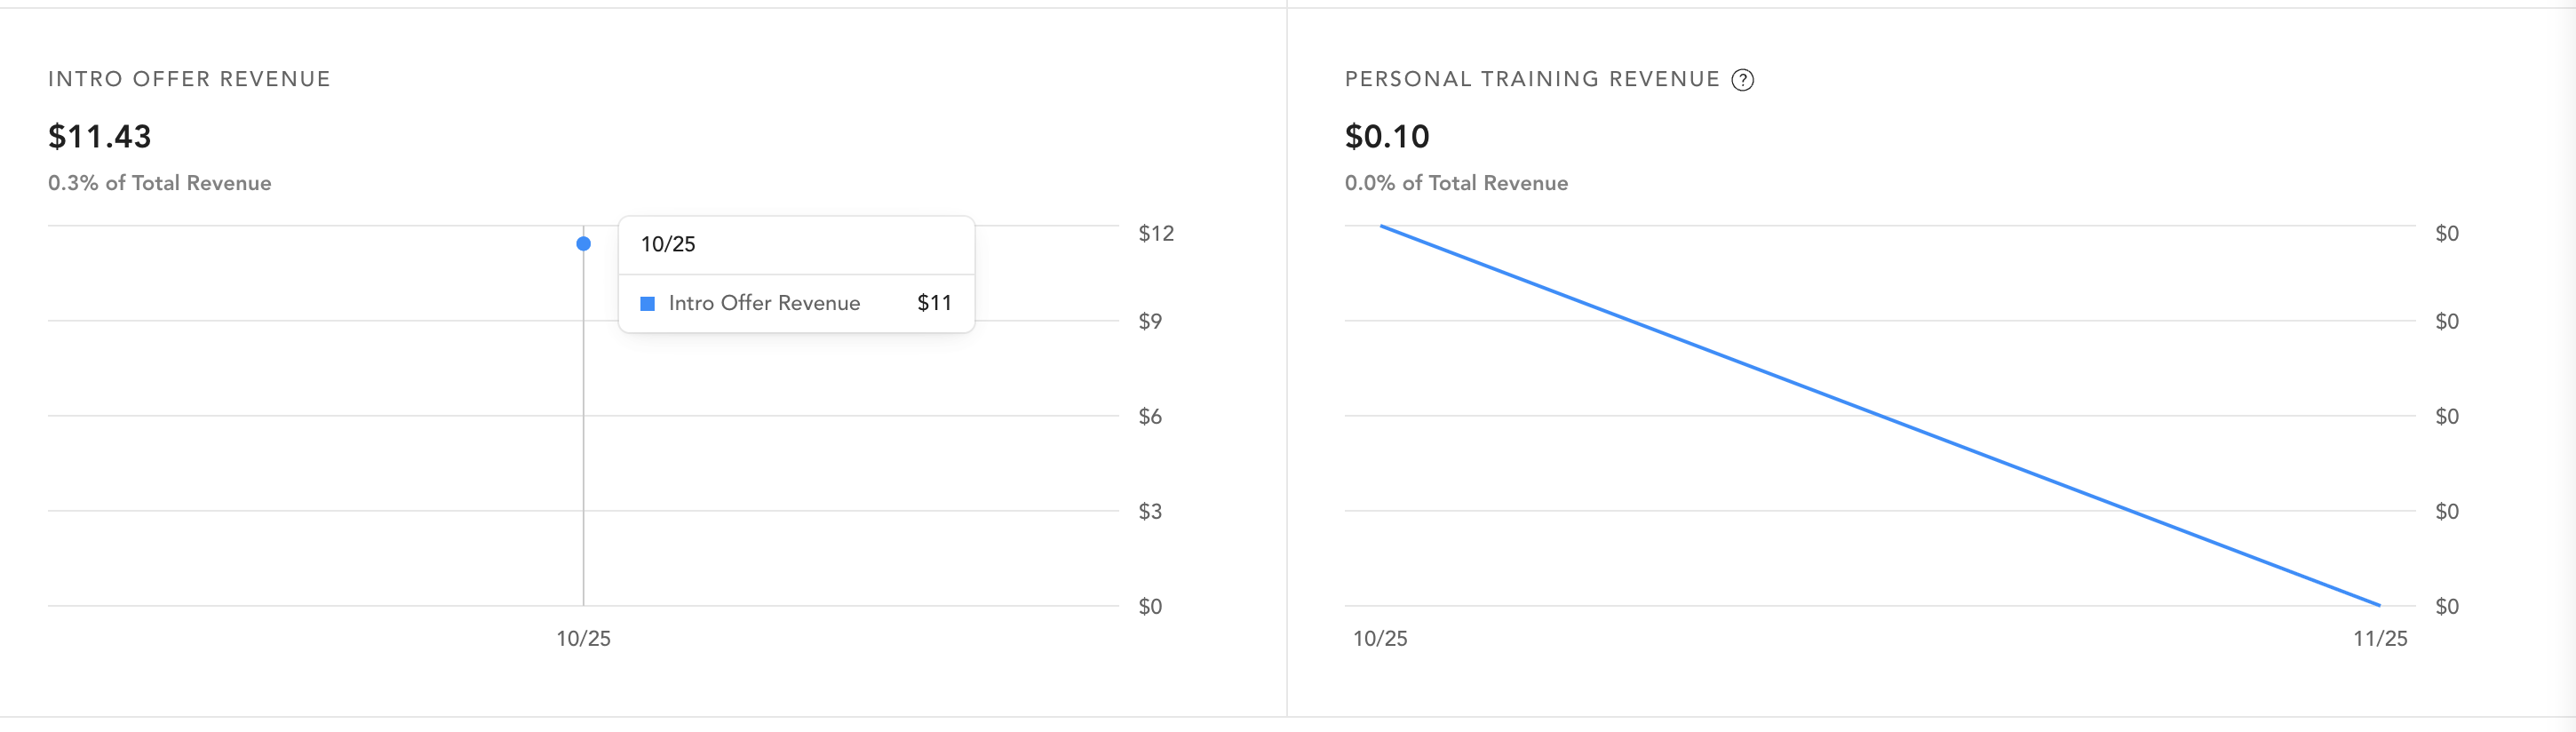
Membership Revenue, Package Revenue, and Intro Offer Revenue Revenue earned from each of those sources.
Personal Training Revenue Revenue from personal training services — a source not broken out on the standard dashboard.
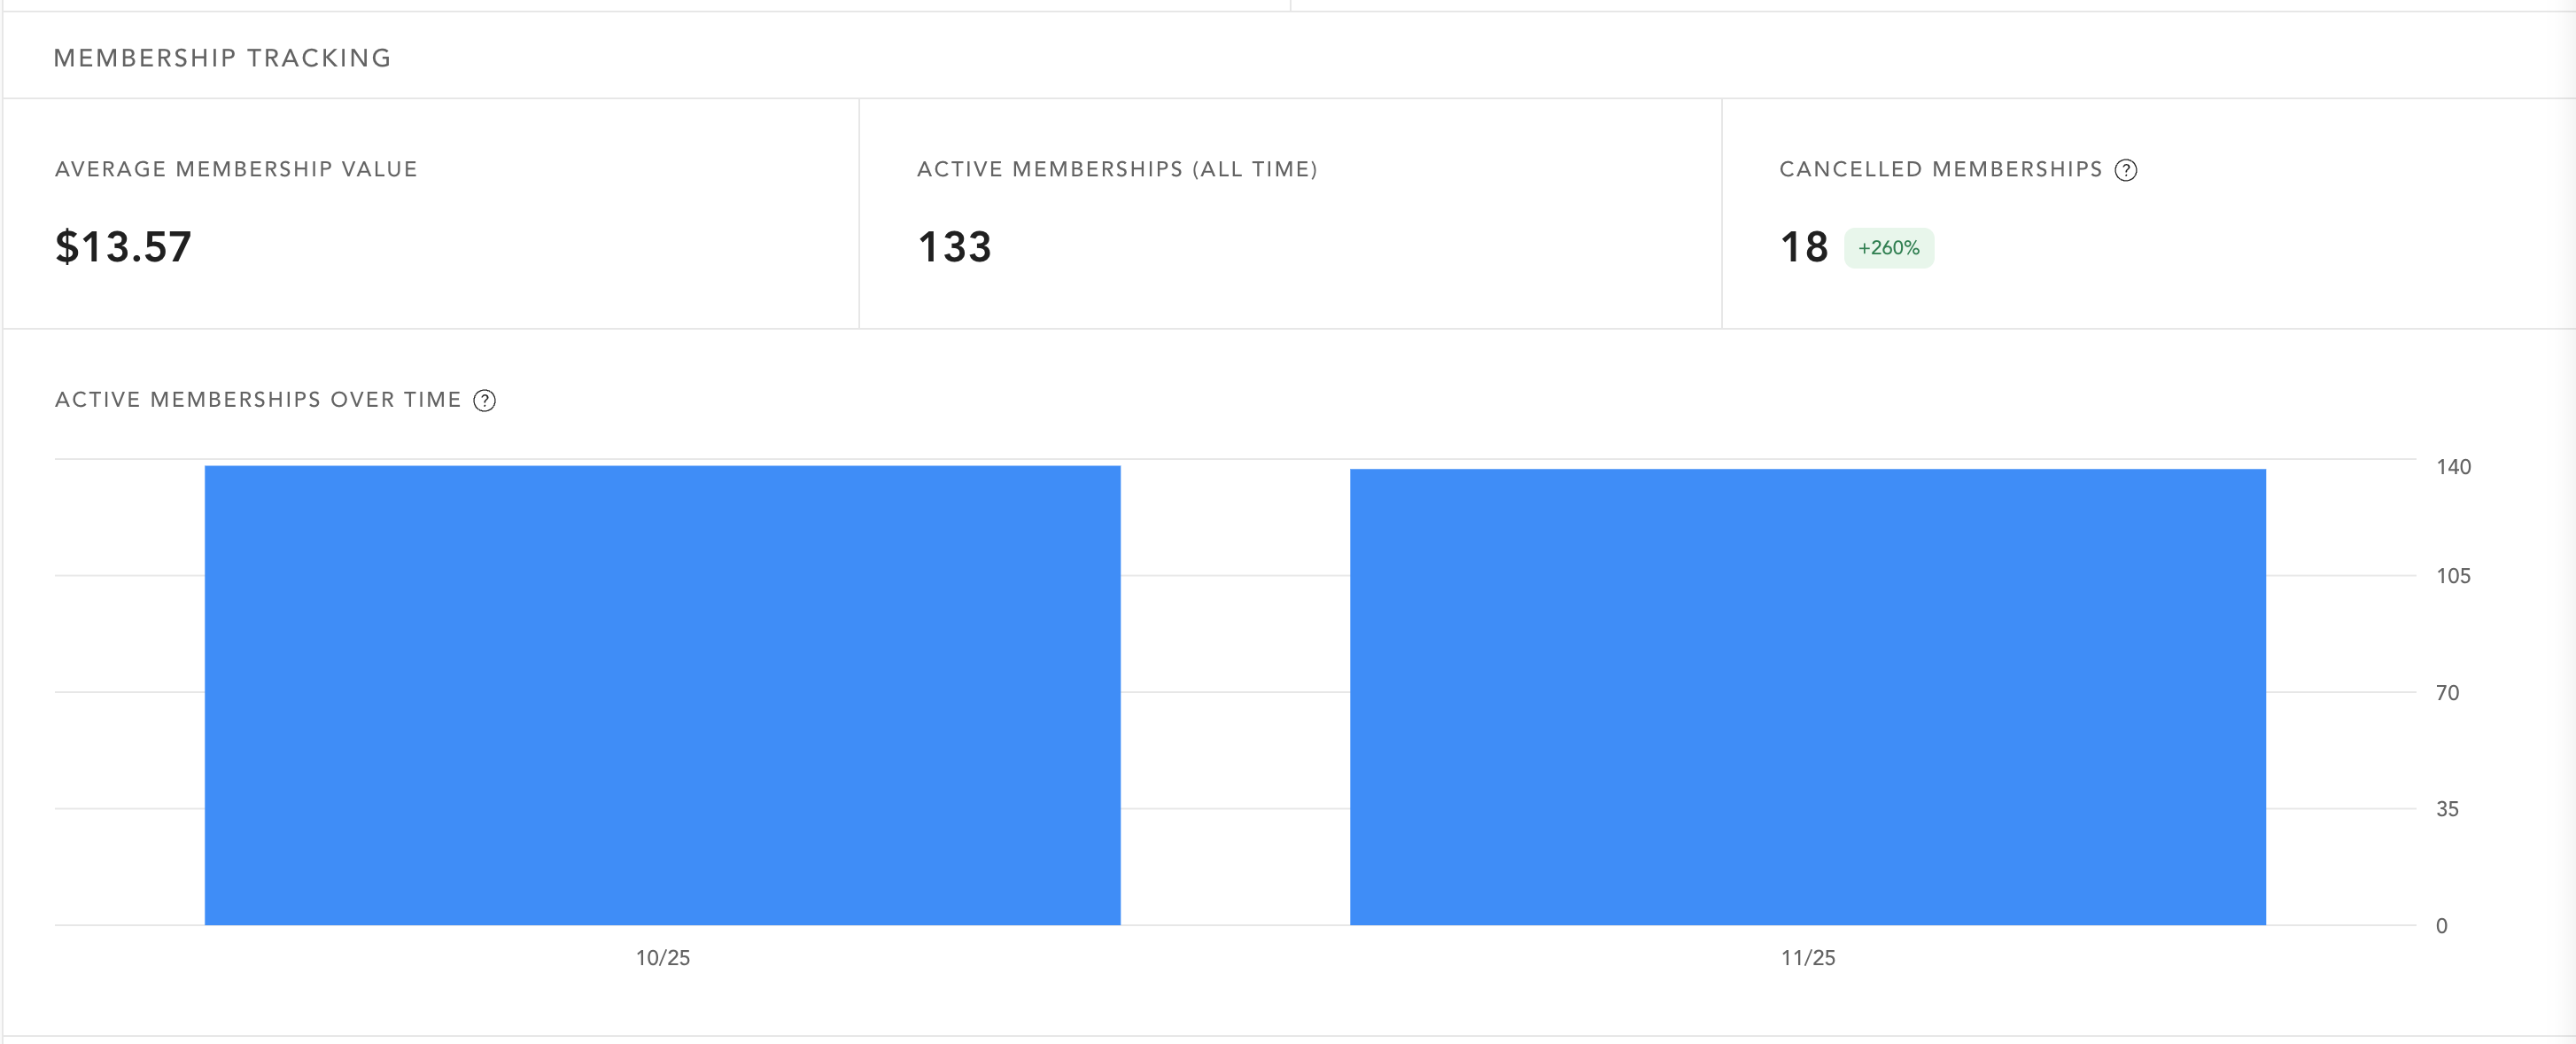
Membership Tracking
Average Membership Value Average value of active memberships.
Active Memberships (All Time) Total number of active memberships to date.
Cancelled Memberships Count of memberships canceled during the period.
Active Memberships Over Time Visual trend of your active membership count across the selected dates. This mirrors the same widget on the standard dashboard.