Client Visit Averages report
See average visits per client by service type and time period.
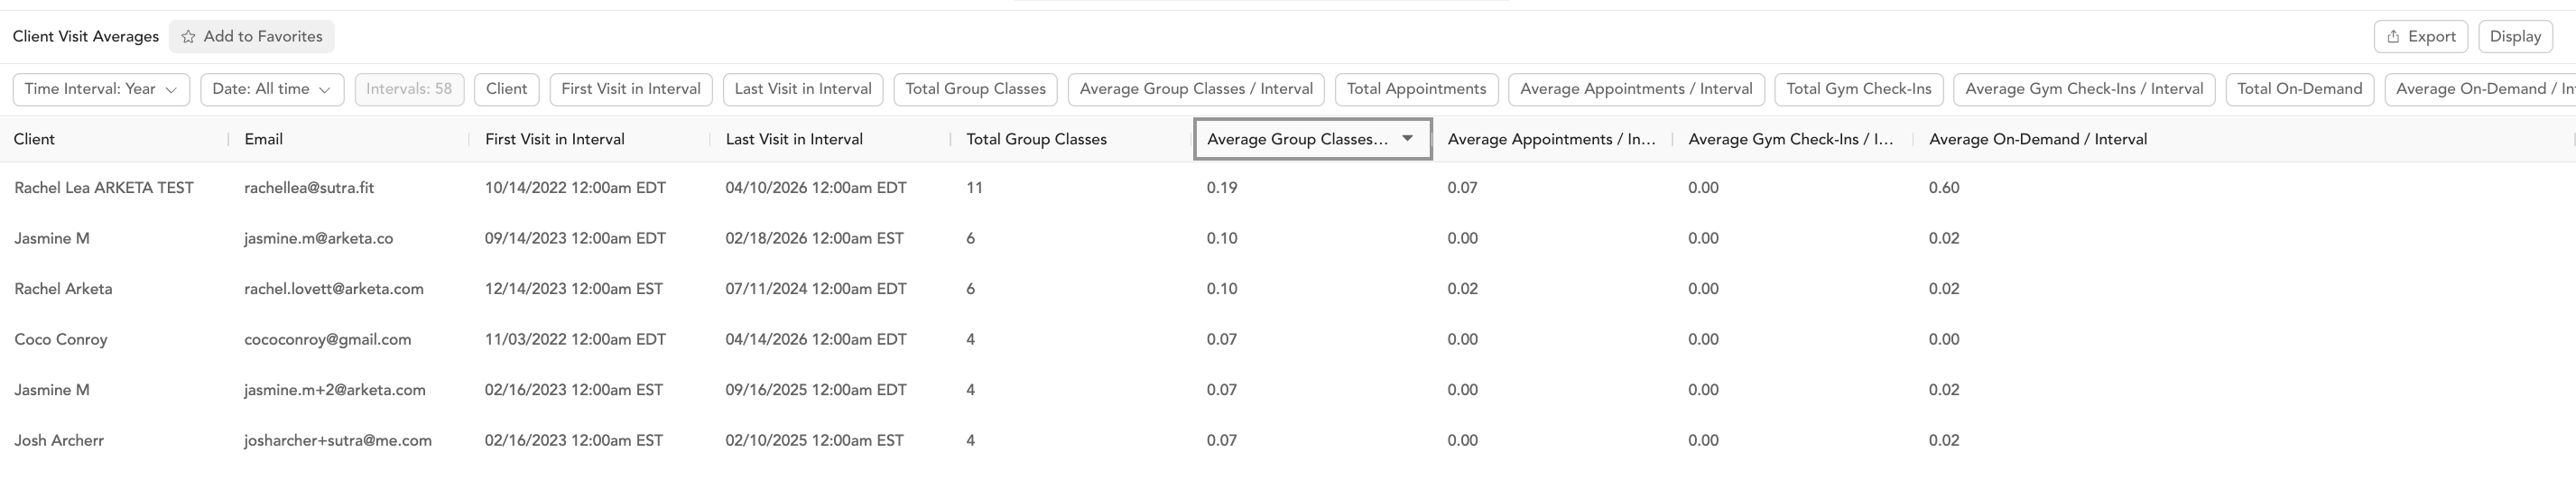
The Client Visit Averages report shows how often clients are visiting, broken down by service type (group classes, appointments, gym check-ins, on-demand views) and time interval.
Columns
| Column | Description |
|---|---|
| Time | Interval — day, week, month, or year |
| Date | Date of the period |
| Client | Client name |
| First visit interval | First visit during this period |
| Last visit interval | Last visit during this period |
| Total group classes | Group classes attended |
| Average group classes | Average per interval |
| Total appointments | Appointments attended |
| Average appointments | Average per interval |
| Total gym check-ins | Gym check-ins (if using a gym check-in feature) |
| Average gym check-ins | Average per interval |
| Total on-demand | On-demand video views |
| Average on-demand | Average on-demand views per interval |
How to use this report
- Identify highly engaged clients — potential brand ambassadors, referral program participants
- Spot declining engagement — clients with lower averages than their history may be at risk
- Track modality trends — are clients shifting from in-person to on-demand?
- Benchmark your average — compare the average visit rate against industry expectations for your membership model
Was this helpful?